Full text rendered from the published PDF. The PDF is the version of record; if the two differ, the PDF governs.
Background: Groundwater is the main water source for public hospitals in Hail City, making its quality essential for providing safe health services, preventing infections, and ensuring patient safety.
Objective: This study aimed to assess the quality of groundwater used in public hospitals in Hail City using the water quality index (WQI) methodology.
Methods: A retrospective descriptive cross-sectional study was conducted using water quality data collected between 2021 and 2024. Physical and chemical parameters were analysed to evaluate the suitability of groundwater for human use in healthcare settings. A total of 28 water quality reports from five major public hospitals were included in the analysis.
Results: The results revealed spatial and temporal variations in groundwater quality across the studied hospitals. Higher levels of total dissolved solids (TDS), electrical conductivity (EC), and total hardness were observed during the summer season, likely due to evaporation and increased ion concentration. Lower values were recorded in winter and autumn, reflecting the influence of climatic conditions. Most water samples were classified as “excellent” according to WQI values. However, Hospital 4 and 5 showed elevated levels of TDS, EC, and hardness, suggesting possible issues related to water treatment or storage systems.
Conclusion: The findings highlight the importance of continuous and season-specific monitoring of groundwater quality in public hospitals. The study also supports the effectiveness of the Water Quality Index (WQI) as a practical tool for ensuring consistent water safety in healthcare facilities.
Keywords: Chemical/Analysis, Drinking Water/Standards, Environmental Monitoring/Methods, Groundwater/Analysis, Hospitals, Saudi Arabia, Water Pollutants, Water Quality/Standards
Access to safe groundwater for drinking purposes is a fundamental human right and an important factor in public health [1]. At the national and regional levels, clean water is a key focus of development planning, with the benefits of water and sanitation projects outweighing their implementation costs [2]. Safe and sufficient water is essential for daily needs such as drinking, food preparation, and hygiene, in addition to specialized medical uses such as dialysis and surgical procedures [3]. The most vulnerable groups, including children and the elderly, are more severely affected by waterborne diseases, highlighting the importance of water quality control and safe groundwater management. [4]. Drinking water standards vary across countries, depending on governance, available resources, and health priorities, and should be designed to suit the local context [5]. In hospital environments, the quality of drinking water is particularly critical due to its direct role in patient care, infection prevention, and medical procedures. In the Hail region, groundwater represents the primary water source for public hospitals, with daily consumption reaching approximately 300,000 litres, making its quality essential for maintaining safe healthcare services [6]. Local assessments have indicated that variations in water quality within hospital systems may influence infection control practices, emphasizing the importance of continuous monitoring in healthcare facilities across Hail City [7]. Ensuring water safety in such settings requires more than reliance on a single control measure. Water quality can be affected by several factors, including source characteristics, treatment efficiency, storage conditions, and distribution systems within hospital infrastructure. For this reason, an integrated approach to water safety is necessary, combining proper source management, effective treatment processes, and secure internal distribution networks to maintain acceptable water quality levels and minimize potential risks [8, 9]. To evaluate groundwater safety, the water quality index (WQI) has emerged as a widely used and practical assessment tool. Introduced
by Horton in the early 1970s, the index simplifies the interpretation of complex water quality data by integrating multiple physical and chemical parameters into a single numerical value that reflects overall water quality at a specific time and location [10]. Although it does not replace detailed laboratory analysis, the WQI provides a useful method for comparing water quality trends over time and between different locations, particularly in institutional settings such as hospitals [11]. The index typically includes parameters such as pH, turbidity, nitrate, total dissolved solids, and microbial counts. The selection and weighting of these parameters may vary based on regional health risks and water source characteristics [12]. Several adaptations of the original WQI model have since been developed to address the specific environmental and public health needs of different regions, including arid zones [13]. In hospital environments, applying the WQI not only facilitates routine monitoring but also informs management decisions about water treatment upgrades, infection control measures, and long-term sustainability planning [14]. Its integration into healthcare infrastructure is especially valuable in areas where water safety is closely linked to patient safety and operational efficiency [15]. Based on these considerations, the present study seeks to address the following research questions: What is the current physicochemical quality of groundwater used in public hospitals in Hail City? How does groundwater quality vary spatially between different hospitals and temporally over the study period from 2021 to 2024? To what extent can the water quality index (WQI) effectively reflect groundwater suitability for healthcare use in public hospitals in Hail City?
MATERIALS AND METHODS Study Design A retrospective descriptive cross-sectional study was conducted in public hospitals in Hail City using existing water quality records. The study analysed physical and chemical water quality data collected over a four-year period from 2021 to 2024 to evaluate groundwater quality trends and variations across hospitals and time.
care, general surgery, intensive care, burn units, and endoscopy services. 5. Hospital 5, providing a wide range of general and specialized medical services, with over 100 outpatient clinics and departments including emergency and critical care. In the studied hospitals, groundwater represents the primary and consistent source of water supply. Although limited on-site treatment processes such as filtration or disinfection may be applied for operational purposes, the water source remains groundwater throughout the hospital water system. Water is typically stored in central storage tanks within hospital premises before distribution to different departments. The capacities of these tanks and water turnover rates vary between hospitals according to size, consumption demand, and storage design. Routine maintenance and periodic cleaning of storage tanks are conducted as part of hospital operational protocols; however, detailed maintenance schedules and turnover frequencies were not uniformly documented across all facilities during the study period
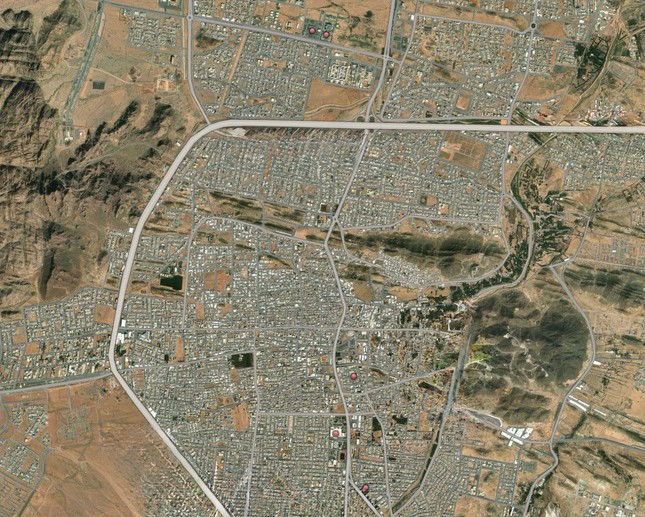
Study Area The study was conducted across five major hospitals in Hail City, in the northwestern region of Saudi Arabia, as shown in Figure 1. These include:
1. Hospital 1, the region’s primary referral hospital, providing primary and secondary healthcare services such as general medicine, surgery, paediatrics, and obstetrics, along with emergency and intensive care units. 2. Hospital 2, a public facility offering basic medical services including emergency care and outpatient clinics. 3. Hospital 3 specializes in maternal and paediatric care with departments for obstetrics, neonatology, paediatric care, and infertility. It recently moved to a modern facility in the Al-Maseef district near Hospital 4, with a capacity of 200 beds and 56 outpatient clinics. 4. Hospital 4, a state-of-the-art medical centre with 500 beds, featuring 55 clinics covering 48 medical specialties such as cardiac surgery, neurology, oncology, nephrology, emergency
investigated in this study.
Sample Collection A total of 28 chemical water analyses were obtained from five public hospitals in Hail City; these were conducted between 2021 and 2024 based on officially documented hospital water quality records. The majority of samples were collected from groundwater storage tanks serving the hospitals’ water supply system, which distributes groundwater to various departments within each hospital, thereby representing the overall quality of water at the point of distribution. In selected cases, samples reflected groundwater supplied to specific service areas connected to the main storage system, as documented in hospital reports, which explains minor variations in sampling locations. Hospital 1 conducted five analyses over the study period. Hospital 2 contributed two samples in 2023 and 2024. Hospital 3 initiated testing in 2024, with two samples. Hospital 4 recorded the highest number of analyses (11 samples). Hospital 5 provided eight samples, with two analyses conducted annually. To ensure consistency, only laboratory results issued by Hail Municipality laboratories were included. A gap in routine testing was observed across hospitals between mid-2022 and late 2023. Hospital identities were withheld to preserve institutional confidentiality; accordingly, they are referred to here by numerical identifiers. All water samples were collected, preserved, and transported according to standard municipal water quality monitoring procedures. Samples were placed in clean, sterilized containers, stored under controlled conditions, and transported to the laboratory within the recommended time frame to prevent chemical alteration prior to analysis. Water Analysis Public health departments within the hospitals routinely conduct water quality assessments to ensure compliance with local and national water standards. These assessments are performed using standard laboratory procedures approved by the Hail Municipality laboratories. Physical parameters such as pH, electrical conductivity (EC), and total dissolved solids (TDS) were measured using calibrated digital meters, while turbidity was determined using a nephelometric turbidity
meter. Chemical parameters, including total hardness, ammonia, fluoride, nitrate, nitrite, phosphate, and chloride, were analysed using standard colorimetric and titrimetric methods in accordance with established water analysis guidelines. All measurements were conducted under controlled laboratory conditions by trained personnel, and recorded results were documented in official hospital water quality reports, which were used as the primary data source for this study. To assess the suitability of groundwater for use in hospital settings, the measured physical and chemical parameters were compared against internationally and nationally recognized drinking water standards. The World Health Organization (WHO) guidelines and the Saudi Arabian drinking water standards were used as reference benchmarks for permissible limits of each parameter. These standards provide threshold values designed to protect public health and ensure water safety for human consumption and healthcare-related uses. The comparison with these standards allowed for an objective evaluation of water quality and supported the interpretation of results across different hospitals and time periods. The physical and chemical parameters of water include several key elements that determine its quality and safety. Physical parameters include pH, which indicates the acidity or alkalinity of the water; TDS, affecting taste and clarity; EC, reflecting the concentration of dissolved salts; turbidity, showing suspended particles that may indicate microbial contamination or organic matter; and total hardness, measuring calcium and magnesium levels that impact water usability. Chemical pollutants include ammonia, produced from organic waste decomposition and posing health risks; nitrate and nitrite, linked to agricultural pollution and toxic especially to infants; fluoride, beneficial in low amounts for dental health but harmful at high levels; chloride, indicating possible contamination from wastewater or industrial sources; and phosphate, which can cause algal blooms and ecological imbalance. Together, these parameters provide a comprehensive overview of water quality,
aiding in assessing safety and compliance with health standards. Quality Control and Assurance To ensure the reliability and validity of the data, multiple quality control assurance procedures were employed throughout the study. These included verifying data sources, cross-checking results from different laboratories, and ensuring consistency in parameter definitions and measurement units. Only officially documented and approved results were included in the final analysis. Data Analysis Data analysis was conducted using Microsoft Excel and SPSS statistical software. Descriptive statistics were used to summarize quantitative parameters, such as mean, standard deviation, minimum, and maximum values. Moreover, g eospatial analysis was used to examine spatial patterns and visualize the distribution of variables across different locations using GIS tools. A comparative Analysis was performed to examine differences between hospitals and across different time periods. In addition, a c orrelation Analysis was applied to assess the relationships between physical and chemical water quality parameters. A significance threshold of p < 0.05 was adopted to determine statistical significance for all inferential tests. Ethical Consideration Ethical approval for this study was obtained under IRB Log Number: 2024-86. All procedures involving data collection and analysis were conducted in accordance with ethical standards and regulations, ensuring confidentiality, transparency, and integrity throughout the research process. Water Quality Index (WQI) The water quality index (WQI) was estimated by adopting the weighted arithmetic index technique. The following steps were followed to calculate the WQI: Step 1: Each sample’s Wn factor was determined using the following formula:
Wn= K
Where:
Sn = standard desirable value of nth parameters Wn = 1 (unity) K = constant of proportionality The value of K = 1; it is a constant value and used to calculate the standard desirable value of each chemical variable [16]. Step 2 The sub-index (Qn) value was calculated using this expression:
Qn= [(Vn−Vo)]
[(Sn−Vo)] x 100
Where: Vn = average concentration of the nth parameter Sn = standard desirable value of the nth parameter Vo = actual values of the parameters in pure water (generally V0 = 0 for most parameters, except for pH)
QpH= [(VpH−7)]
[(8.5 −7)] x 100
Step 3: Step 1 and Step 2 were combined to determine WQI:
Overall WQI= ∑WQn
∑Wn
The calculated WQI values were classified into five groups, as shown in Table 2. The values ranged from < 25 (excellent water quality) to >100 (highly polluted water), which is considered unsuitable for drinking and other healthcare-related uses within hospital settings [10].
Groundwater Quality A total of 28 groundwater reports were included in this analysis, broken down as follows: 1. Five reports from Hospital 1, including two from 2021, one from 2022, and one each from 2023 and 2024. 2. Two reports from Hospital 2, one from 2023 and the other from 2024. 3. Two reports from Hospital 3, both conducted in 2024. 4. Eleven reports from Hospital 4, with Five conducted in 2021, three in 2022, one in 2023, and two in 2024. 5. Eight reports from Hospital 5, with two reports conducted each year from 2021 to
Sn
2024. The physical and chemical parameters of groundwater quality in Hail public hospitals showed significant variation over the four years (2021–2024), as indicated in Table 3. Readings from Hospital 1 demonstrated relative stability, with pH levels maintaining moderate values (7.48–8.3) within the acceptable range. Turbidity also remained low (0-0.5), indicating water clarity. However, levels of total dissolved solids (TDS) and electrical conductivity (EC) gradually increased between 2022 and 2024, with TDS reaching 214.4 and EC at 468.5 in 2022, and similar values recorded in 2024 (TDS: 214, EC: 464). These finding may suggest the beginning of salt or impurity accumulation in the water system. Total hardness increased significantly in 2024 (112.1) compared with previous years, raising concerns about potential hard water development. Ammonia, fluoride, nitrate, nitrite, chloride, and phosphate levels remained within acceptable limits. Data for Hospital 2 were available only for 2023 and 2024. pH levels remained within the permissible limits (6.5–7.6), but TDS and EC showed a significant increase in 2024 (TDS: 299.9; EC: 444.1), exceeding international drinking water standards. These results may indicate potential contamination or elevated concentrations of dissolved salts. Total hardness reached 146.33, which is acceptable, and all other chemical components, including ammonia, fluoride, nitrate, nitrite, chloride, and phosphate, remained within acceptable limits, with no critical indicators observed. For Hospital 3, the only available reports were from 2024. The pH levels remained within the acceptable range (7.35–7.7). However, relatively elevated values of TDS (391.6 mg/L) and EC (569.2 μS/cm) were observed, exceeding international drinking water standards and indicating potential contamination or high concentrations of dissolved salts. Total hardness was 53.4 mg/L, which is within acceptable limits. Other chemical parameters, including ammonia, fluoride, nitrate, nitrite, chloride, and phosphate, remained within permissible limits with no critical indicators. Hospital 4 exhibited sharp fluctuations and significant elevations in several parameters. In
2022, the pH reached 10.21, exceeding the acceptable limit, while in other years it remained within range (6.6–8.5). In 2024, the highest values were recorded for TDS (289.1) and EC (618.4), indicating high salinity levels. Total hardness was also high in 2024, reaching 182.9 mg/L, indicating a noticeable increase compared with previous years, while still remaining within permissible limits . Phosphate concentrations spiked in 2022 (1.16), and chloride levels increased slightly in 2024 (209). Other parameters, such as ammonia, fluoride, nitrate, nitrite, and phosphate, remained within acceptable ranges without critical indications. Finally, reports from Hospital 5 showed findings similar to those of Hospital 4, with pH levels remaining within a moderate range (6.4–7.7). However, TDS and EC exceeded acceptable limits in all recorded years, suggesting the accumulation of salts or impurities in the water system. The highest chloride concentration was recorded in 2022 (305), and total hardness increased significantly in 2024 (367.1). Other chemical parameters, including ammonia, fluoride, nitrate, nitrite, and phosphate, remained within acceptable limits, with no critical indicators observed. The Impact of Storage Locations on Groundwater Quality At Hospital 4, three water samples were collected on the same day from three different locations: the water tank, the desalination plant, and the service building. The results in Table 4 show different findings for each sample, indicating variations in water quality among these sources All analyses complied with Saudi and WHO standards, except for that of EC. This apparent non-compliance relates to the operational reference value used in this study (300 μS/cm), which served as a conservative benchmark within the WQI calculation framework rather than an official regulatory limit. According to WHO and SASO guidelines, no health-based maximum permissible limit is explicitly defined for EC. Some variations in values were observed due to the influence of the sampling location. The values of pH, TDS, EC, total hardness, ammonia, nitrates, and phosphates were
higher in the service building samples compared with the water tank samples. In contrast, a lower chloride values were observed in the sample from the service building. In the sample from the desalination plant, all values were lower than those of the water tank and service building samples. The observed elevation in both pH and ammonia in the service building sample may be attributed to multiple factors. One possible explanation is the addition of chlorine-based disinfectants to eliminate microbial contaminants. During this disinfection process, chlorine reacts with organic nitrogen compounds—often originating from bacterial cells—which can lead to the formation of ammonia as a byproduct. Furthermore, the
Water unsuitable for drinking
decomposition of microbial biomass releases nitrogenous compounds, which are subsequently converted into ammonia in the aqueous environment. This accumulation of ammonia contributes to an increase in pH, as ammonia exists in equilibrium with ammonium (NH4+) and hydroxide ions (OH−), the latter of which raise the water’s alkalinity [19]. The variations in the sample values resulted in a change in the WQI, shifting the water quality from excellent in the samples from the desalination plant and the “white” tank, to good in the service building sample. This change is associated with the use of water from the main reservoir at Hospital 4, which impacts the overall water quality.
Excellent
water between excellent and good. In 2022, the range was wider, from 24.3451 to 90.8361, extending from excellent to very poor, likely due to elevated pH and EC levels. In 2023, a WQI value of 2.0765 was recorded, indicating excellent water quality, while values in 2024 ranged between 8.8641 and 27.5399, classifying the water from excellent to good. Finally, at Hospital 5, the WQI values in 2021 ranged from 23.4805 to 34.1303, reflecting water quality from excellent to good. In 2022, the values ranged between 15.1197 and 26.6006, maintaining the same classification range, with the higher values attributed to increased levels of TDS, EC, and chloride. In 2023, values ranged between 2.30711 and 31.5774, again indicating water quality ranging from excellent to good. In 2024, the values ranged from 0.4974 to 8.2737, consistently indicating excellent water quality. Correlation between Water Quality Variables Pearson’s correlation analysis was applied to analyze the relationships between different water quality parameters, as indicated in Table 5. There were significant positive correlations between pH, nitrite, and ammonia (r = 0.618– 0.701, p < 0.01).as well as significant correlations between TDS and the following parameters: EC, hardness, and chloride (r = 0.7079–0.8502, p < 0.01). Subsequent correlation analysis indicated highly significant positive correlations between EC and chloride (r = 0.9218, p < 0.01). The strong correlations between several water quality parameters reflect common controlling factors influencing groundwater chemistry in hospital water systems. The significant positive association between TDS and EC is expected, as EC is directly related to the concentration of dissolved ionic species in water, and higher TDS values generally result in increased EC. Similarly, the strong correlation between EC and chloride indicates that chloride ions contribute substantially to the overall ionic content of the water, particularly in groundwater sources affected by mineral dissolution or concentration processes. In addition, the positive relationship between hardness, TDS, and EC suggests that calcium and magnesium ions play a role in increasing
dissolved solids and conductivity levels. These relationships may be influenced by geological characteristics of the aquifer, evaporation effects, and internal water storage conditions within hospital systems. The observed associations indicate that variations in these parameters are not independent but are driven by shared physicochemical processes affecting groundwater quality in the studied hospitals. The strong correlations between these measured variables indicate that they were affected by the same environmental factors. Weak but statistically significant positive correlations (r = 0.1781–0.5211, p < 0.01) was observed between EC, turbidity, hardness, fluoride, nitrate, and phosphate. In addition, a weak negative but statistically significant correlation was found between pH and fluoride (r = -0.0611–-0.1158, p < 0.01), and a weak negative correlation between ammonia and chloride (r = -0.15125, p < 0.01). Seasonal Variation in Water Quality Parameters in Hail Public Hospitals A seasonal analysis was conducted to examine the quality of groundwater stored in hospital tanks across the Hail region, as presented in Table 6. This analysis aimed to identify variations in the physical and chemical characteristics of groundwater across the four seasons (winter, spring, summer, and autumn) based on data collected over the four-year period. Seasonal variations in groundwater quality are expected in arid regions such as Hail due to changes in temperature, evaporation rates, rainfall patterns, and groundwater recharge. Higher temperatures during summer can enhance evaporation, leading to increased concentration of dissolved salts and ions, while cooler conditions in winter and spring may promote dilution effects and more stable water quality conditions. In addition, variations in water demand, storage duration, and operational practices within hospital water systems may further contribute to seasonal fluctuations in measured parameters. The seasonal reports of water quality parameters in Hail public hospitals revealed noticeable variations across the four seasons. In winter, the pH level was 7.154, indicating a near-neutral to slightly alkaline condition. TDS measured 229.30 mg/L, and EC was
463.50 μS/cm, both reflecting a moderate level of dissolved salts. Turbidity was low (0.150 NTU), indicating clear water, while total hardness was 72.98 mg/L, suggesting moderately hard water. Ammonia (0.020 mg/L), fluoride (0.45 mg/L), nitrate (2.00 mg/L), nitrite (0.008 mg/L), phosphate (0.15 mg/L), and chloride (82.35 mg/L) concentrations were all within acceptable limits. During spring, the pH increased to 7.645, with a decline in TDS (189.77 mg/L) and EC (375.26 μS/cm), indicating lower ionic content. Turbidity rose slightly to 0.194 NTU, while total hardness decreased to 64.65 mg/L. Nitrate (2.76 mg/L) and nitrite (0.017 mg/L) levels increased slightly compared with winter, but remained within permissible levels. Fluoride (0.51 mg/L) and phosphate (0.25 mg/L) also showed moderate levels, while chloride was recorded at 73.10 mg/L. In summer, TDS peaked at 316.55 mg/L and EC at 589.11 μS/cm, likely due to increased evaporation and concentration of dissolved ions. Turbidity was low (0.058 NTU), indicating highly transparent water, and total hardness reached its highest level (136.83 mg/L), suggesting hard water. Ammonia (0.008 mg/L), fluoride (0.20 mg/L), nitrate (1.06 mg/L), and nitrite (0.008 mg/L) concentrations were the lowest across the year, while phosphate was minimal (0.02 mg/L). Chloride also reached its lowest level in summer (49.02 mg/L). In autumn, pH was 7.190, while TDS (245.08 mg/L) and EC (494.38 μS/cm) remained at moderate levels. Turbidity reached its lowest level (0.023 NTU), reflecting excellent visual clarity, while total hardness also dropped to its lowest point (50.50 mg/L), indicating soft water. Fluoride reached its highest value (0.66 mg/L), and phosphate also increased (0.30 mg/L), possibly due to changes in water source or environmental runoff. Although chloride concentrations are commonly expected to peak during summer due to evaporation effects, the highest chloride level in this study was observed during autumn. This variation does not indicate a data entry error but may be attributed to changes in groundwater flow dynamics and water management practices within hospital
systems. Seasonal recharge following late summer rainfall, mixing of groundwater from different sources, or operational factors such as tank cleaning, refilling cycles, or changes in storage duration may contribute to localized increases in chloride concentrations during autumn. Similar deviations from typical seasonal patterns have been reported in groundwater systems influenced by operational and infrastructural factors rather than climatic conditions alone. Ammonia (0.020 mg/L), nitrate (2.50 mg/L), and nitrite (0.012 mg/L) remained within safe limits. Chloride concentration was highest in autumn (106.80 mg/L), though still below the permissible threshold (250 mg/L).
The results of the study revealed that the majority of groundwater samples collected from Hail public hospitals between 2021 and 2024 fell within the recommended limits set by national and international drinking water standards. This finding aligns with previous studies, such as that of Alotaibi & Alghamdi (2022), who demonstrated the effectiveness of water quality monitoring systems in Saudi healthcare facilities and their compliance with established health and regulatory requirements [20]. However, significant variations in water quality were observed between the different hospitals as well as across seasons, indicating the influence of diverse environmental and climatic factors, in addition to variations in the efficiency of internal water treatment and storage systems. These seasonal changes were expected, as previous environmental studies have linked elevated temperatures with increased evaporation and higher concentrations of total dissolved solids ( TDS ) in groundwater [21]. Hospital 4 and Hospital 5 exhibited higher levels of critical parameters, including TDS, electrical conductivity ( EC ) , and total hardness—particularly during the summer months. These fluctuations may be attributed to ageing water infrastructure, elevated evaporation rates, or reduced efficiency in treatment and storage systems. These findings underscore the urgent need for regular maintenance and ongoing technical upgrades
in these facilities to prevent water quality deterioration. This is supported by research indicating that ageing infrastructure increases the risk of water contamination in healthcare settings [20]. In contrast, Hospital 1, Hospital 2, and Hospital 3 maintained stable and satisfactory water quality levels, which may reflect the implementation of more effective water management practices or the presence of newer infrastructure. This highlights the importance of investing in modern equipment and effective water systems to ensure the safety of water used in healthcare, aligning with global recommendations for the prevention of waterborne healthcare- associated infections [22]. The results indicate that groundwater quality in most public hospitals in Hail City was generally acceptable, with more than 70% of the samples classified as excellent. This reflects the effectiveness of existing water management and monitoring practices in many facilities. However, the occurrence of samples classified as good or lower highlights the need for specific corrective actions. These include regular inspection and maintenance of water storage tanks, upgrading treatment and filtration systems where elevated TDS, EC, or total hardness levels were observed, and implementing season-specific monitoring programs, particularly during summer months. In addition, strengthening internal water distribution management and ensuring a timely response to deviations from acceptable limits are recommended to maintain consistent water quality and support safe healthcare services. Limitations & Recommendations This study relies on data extracted from previous reports without conducting direct field sampling, which may affect the overall accuracy of the water quality assessment. Moreover, these reports did not include biological or microbiological analyses, which are essential components for evaluating water safety in hospital environments. Additionally, the number of water samples was unequal across the different hospitals, which represents a significant limitation and may affect the generalisability of the findings
when comparing water quality between facilities. The water samples were also collected from various departments within each hospital and by different public health specialists, which may have introduced variability in sampling methods and affected result consistency. Therefore, future studies should adopt a standardized sampling protocol implemented by a single, unified team, with balanced sample numbers across hospitals, and incorporate more comprehensive analyses to fully assess these critical aspects.
This study highlights the critical importance of assessing water quality in public hospitals as a fundamental component of ensuring a safe and healthy environment for patients and healthcare staff. Applying the water quality index (WQI) methodology, a comprehensive analysis was conducted of the physicochemical properties of groundwater sources in hospitals across Hail City from 2021 to 2024. The findings revealed that the majority of samples complied with both national and international standards, indicating the effectiveness of current monitoring systems and adherence to regulatory requirements. However, the noticeable variations in water quality between hospitals and across seasons reflect operational and environmental challenges that may compromise water safety—particularly in facilities with ageing infrastructure or inadequate treatment and storage systems. These gaps underscore the need to strengthen water management practices in healthcare institutions through preventive maintenance, continuous infrastructure upgrades, and strict adherence to regular monitoring protocols. Furthermore, the WQI proved to be a reliable and efficient analytical tool, capable of translating complex water quality data into a simplified numerical value that supports informed decision-making. This study emphasizes the importance of ongoing research in this area and recommends expanding the scope of assessments to include microbiological and health-related indicators, thereby enhancing water safety in healthcare
facilities and contributing to the overall improvement of healthcare service quality.
| Water Class | Type of Water WQI | Value Range | |
|---|---|---|---|
| I | Excellent | <25 | |
| II | Good | 26-50 | |
| III | Poor | 51-75 | |
| IV | Very poor | 76-100 | |
| V | Unsuitable | >100 | |
| DOI: 10 52609/jmlph v6i2 253 | | E-mail: emanx23@icloud com | ||
| Journal of Medicine, Law & Public Health Vol | 6. No 2 2026 | ARETION Publishing Group p934 |
| Parameters | Tanker | Desalination Station | Service Build |
|---|---|---|---|
| PH | 7.1 | 6.6 | 7.6 |
| TDS (mg/L) | 161.8 | 34.5 | 179.6 |
| EC (µS/cm) | 334.5 | 72.4 | 370.6 |
| Turbidity (NTU) | 0.3 | 0.2 | 0.3 |
| Total hardness (mg/L) | 37.6 | 1.98 | 51.48 |
| Ammonia(mg/L) | 0 | 0 | 0.02 |
| Fluoride (mg/L) | 0.22 | 0.17 | 0.81 |
| Nitrate(mg/L as N) | 2.8 | 0.8 | 3.1 |
| Nitrite(mg/L) | 0.004 | 0.004 | 0.004 |
| Phosphate(mg/L) | 0.15 | 0.18 | 0.28 |
| Chloride (mg/L) | 56.8 | 18.17 | 52.2 |
| WQI | 13.54 | 14.47 | 30.41 |
| 10.52609/jmlph.v6i2.253 | | E-mail: emanx23@icloud.com | ||
| of Medicine, Law & Public Health Vol 6. No | 2 2026 | ARETION Publishing Group p936 |
| Parameters PH | TDS | EC | Turbidity | Hardness | Ammonia | Fluoride | Nitrate | Nitrite | Phosphate Chloride |
|---|---|---|---|---|---|---|---|---|---|
| PH 1 | |||||||||
| TDS 0.025308 | 1 | ||||||||
| EC -0.0078 | 0.725389 | 1 | |||||||
| Turbidity 0.07243 | 0.0333 | 0.17139 | 1 | ||||||
| Hardness 0.038243 | 0.850255 | 0.466033 | 0.045113 | 1 | |||||
| Ammonia 0.701359 | -0.17815 | -0.15056 | 0.020923 | -0.19949 | 1 | ||||
| Fluoride -0.0611 | 0.462841 | 0.4729 | -0.09472 | 0.266995 | -0.02653 | 1 | |||
| Nitrate 0.107238 | 0.217299 | 0.521175 | 0.452371 | 0.059334 | 0.084696 | 0.215939 | 1 | ||
| Nitrite 0.618191 | -0.0542 | 0.010296 | -0.16743 | -0.14799 | 0.64933 | 0.039164 | -0.06132 | 1 | |
| Phosphate -0.11581 | 0.033097 | 0.205041 | -0.07775 | -0.12254 | -0.01586 | 0.127014 | 0.545398 | -0.03796 | 1 |
| Chloride -0.00719 | 0.707914 | 0.921835 | 0.099904 | 0.507595 | -0.15125 | 0.349067 | 0.539352 | 0.041742 | 0.142738 1 |
| DOI: 10.52609/jmlph.v6i2.253 | | E-mail: emanx23@icloud.com | ||||||||
| The Journal of Medicine, Law & | Public Health Vol | 6. No 2 2026 | ARETION Publishing Group p937 |
| Parameters | Winter | Spring | Summer | Autumn |
|---|---|---|---|---|
| PH | 7.154 | 7.645 | 7.500 | 7.190 |
| TDS (mg/L) | 229.30 | 189.77 | 316.55 | 245.08 |
| EC (µS/cm) | 463.50 | 375.26 | 589.11 | 494.38 |
| Turbidity (NTU) | 0.150 | 0.194 | 0.058 | 0.023 |
| Total hardness (mg/L) | 72.98 | 64.65 | 136.83 | 50.50 |
| Ammonia(mg/L) | 0.020 | 0.020 | 0.008 | 0.020 |
| Fluoride (mg/L) | 0.45 | 0.51 | 0.20 | 0.66 |
| Nitrate(mg/L as N) | 2.00 | 2.76 | 1.06 | 2.50 |
| Nitrite(mg/L) | 0.008 | 0.017 | 0.008 | 0.012 |
| Phosphate(mg/L) | 0.15 | 0.25 | 0.02 | 0.30 |
| Chloride (mg/L) | 82.35 | 73.10 | 49.02 | 106.80 |
| 10.52609/jmlph.v6i2.253 | | E-mail: emanx23@icloud.com |