Full text rendered from the published PDF. The PDF is the version of record; if the two differ, the PDF governs.
Background : Routine monitoring in public health and primary care settings benefits from a compact, population-level metric that summarizes multi-domain burdens in an interpretable way.
Aims : To introduce the Newfoundland and Labrador Population Health Index (NLPHI) and a reference computerized implementation designed to be interpretable, auditable, and computationally transparent.
Methods : NLPHI aggregates domain-specific intensity and mortality terms into domain-specific affect values (DSAV) and returns a scalar Population Health Index (PHI) by averaging DSAV scores across domains within defined reporting periods. The formulation connects to life-table and burden-of-disease thinking by combining a time-loss component with a remaining-life-expectancy-weighted mortality component, while remaining intentionally lightweight relative to formal disability-adjusted life years (DALY) calculation. A reference computerized application was implemented for feasibility evaluation using publicly available validated datasets.
Results : The approach yields per-domain DSAV scores and an overall PHI suitable for routine monitoring, communication, and longitudinal review. The computerized application demonstrates reproducible computation, auditability, and trend visualization without reliance on proprietary databases.
Conclusion : NLPHI provides a pragmatic, transparent framework for population-level health assessment and tracking. Strengths and limitations are outlined, and avenues for calibration and further validation studies are identified to support broader deployment.
Keywords: Disability-Adjusted Life Years, Health Status Indicators, Life Expectancy, Mortality, Public Health
Systems that summarize complex, heterogeneous health information into a single, interpretable figure are frequently requested by local programs, small clinics, municipal teams, and even regional and global health authorities. Composite indicators can assist in allocating attention, triaging limited resources, and communicating trajectories to specialists and non-specialists alike. However, when such tools are deployed within or outside large enterprise environments, certain constraints recur: the interface must be familiar and the output must be reproducible with modest technical effort. The Newfoundland and Labrador Population Health Index (NLPHI) was created with these constraints in mind. The index blends (i) a time- loss term entered in familiar calendar units (days, weeks, months, or years) and (ii) a mortality term scaled by the difference between local average life expectancy and mean age; together, these produce a domain-specific affect value (DSAV). An overall population health index (PHI) is the average of a set of DSAV values across domains recorded for a specific period. An accompanying computerized application implements data entry, computation, storage, and visualization, based primarily on the Python programming language. The connection to life-table and burden-of-disease thinking is acknowledged; however, the framework deliberately avoids claims of formal disability-adjusted life years (DALY) calculation or calibrated risk prediction [1–5]. The remainder of this paper describes the formulation, software architecture, and practical considerations of NLPHI and its implementation. Emphasis is placed on making every step inspectable and reproducible, from the conversion of time units to the calculation of domain values and the rendering of figures. The reference implementation is a single-workstation Qt application with hash-based credential storage and simple region registries, designed for settings
where enterprise electronic medical records (EMR) or a multiuser database may not be available [6-10]. METHODS 2.1 Design Constraints The following design constraints guided the development of NLPHI:
(A) Accessible through offline, standalone
software.
(B) Computerized application based on
widely used Python programming language [11].
(C) Period-centric workflow: data keyed by
specific period(s), with domain rows entered on demand; a dashboard produces a line plot for the main index and a heat map for domain values. 2.2 Formulation and Implementation 2.2.1 Metrics and Indices Metrics such as domain-specific total length of hospital stays (DSTLHS), domain-specific mortality (DSM), period-specific mean age (PSMA), period-specific life expectancy (PSLE), and period-specific population number (PSPN) were utilized to compute indices such as domain- specific total life-years affected (DSTLYA), domain-specific affect value (DSAV), and population health index (PHI), using specific formulas [Table 1]. The metrics serve as open and objective weights (including period-specific mean age, average life expectancy, population number, and domain-specific mortality) to ensure period- specific and objective outcome measurement when computing the indices. Time units are converted to years via fixed multipliers: 1 day = 1/365.25 year; 1 week = 1/52.14 year; 1 month = 1/12 year; 1 year = 1 year. This follows standard calendrical approximations and produces a floating-point time-loss in years. The NLPHI architecture employs a period-centric longitudinal workflow in which health data are indexed to discrete reporting intervals, such as the 2020–2022 fiscal biennium, while retaining the
computational versatility to integrate temporal loss units across multiple granularities, ranging from days to years. The determination of these observation windows is fundamental to the statistical validity of the metric. Specifically, the use of multi-year aggregates mitigates the volatility inherent in small-population datasets, thereby ensuring robust point estimates. Furthermore, these temporal frameworks facilitate the identification of longitudinal health trajectories, such as the epidemiological shifts precipitated by the COVID-19 pandemic. By anchoring dynamic variables, including mean cohort age and population denominator, as period- specific weights, the framework necessitates rigorous computational normalization to maintain the scalar integrity and contextual relevance of the final health index.
are objective, ensures accurate outcome measurement. The NLPHI architecture is well suited for routine population-level monitoring in settings that require concise and interpretable synthesis of multi-domain health burdens. This computerized framework is specifically designed for public health and primary care settings where enterprise EMR systems or multiuser databases are unavailable, and it prioritizes transparency and reproducibility over complex risk prediction. It is most effectively used as a pragmatic monitoring tool for tracking longitudinal health outcomes and visualizing trends across customizable domains, including demographic cohorts, geographic regions, or specific organ systems. Furthermore, its inherent adaptability permits the construction of domains based on physiological, psychological, or social determinants to ensure objective measurement across diverse public health contexts. Given that the approach relies upon metrics such as mean age, life expectancy, and mortality derived from routinely accessible databases, it functions as a statistical modeling platform rather than a clinical diagnostic tool. Consequently, the application of this index should be regarded as a foundation for future calibration efforts and not as a total replacement for formal burden-of-disease estimations or complex life- table analyses.
Table 2. Canadian region- and period-specific data for total length of hospital stays
stay (LOS) (2020-2021) Newfoundland and
Labrador
Prince Edward Island 136,374 111,732 Nova Scotia 783,977 753,433 Table 3. Metrics-specific provincial data Province Fiscal
Newfoundland
2020-21 45.1 79.2* 520,553 5,420 2021-22 45.3 79.2* 525,972 5,850 Prince Edward
& Labrador
2020-21 43.1 81.2 164,318 1,345 2021-22 44.0 80.9 170,688 1,460 Nova Scotia 2020-21 44.2 80.4 992,055 9,670 2021-22 44.5 79.8 1,019,725 10,650 *Values marked with an asterisk represent a multi-year average (2020–2022), as single-year life expectancy for these smaller populations is often aggregated for statistical accuracy.
Island
2.3.2 Data Processing
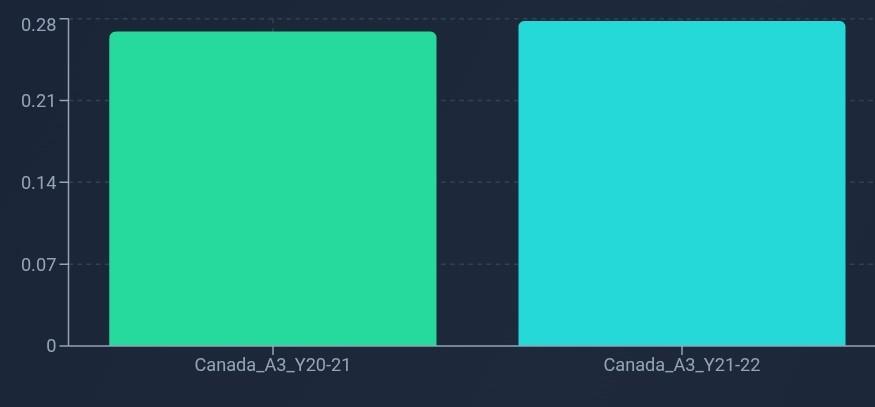
The average age was calculated from province- specific mean ages for the periods 2020–2021 and 2021–2022; the obtained values (in years) were 44.13 and 44.60, respectively. Mean life expectancy values were 80.26 years (2020–2021) and 79.96 years (2021–2022); total population figures were 1,676,926 and 1,716,385, respectively. All metrics-specific data were used to populate the data templates, labeled Canada_A3_Y20-21 and Canada_A3_Y21-22, in the computerized system for the periods 2020– 2021 and 2021–2022, respectively (Figure 3). 2.3.3 Computation Upon completion of data processing, the system’s automated functions was applied to compute the indices. The automated process involves computing DSTLYA values to determine DSAV and PHI values. DSAV values for NL, PEI, and NS were determined as 0.2660, 0.0661, and
387,846 362,241
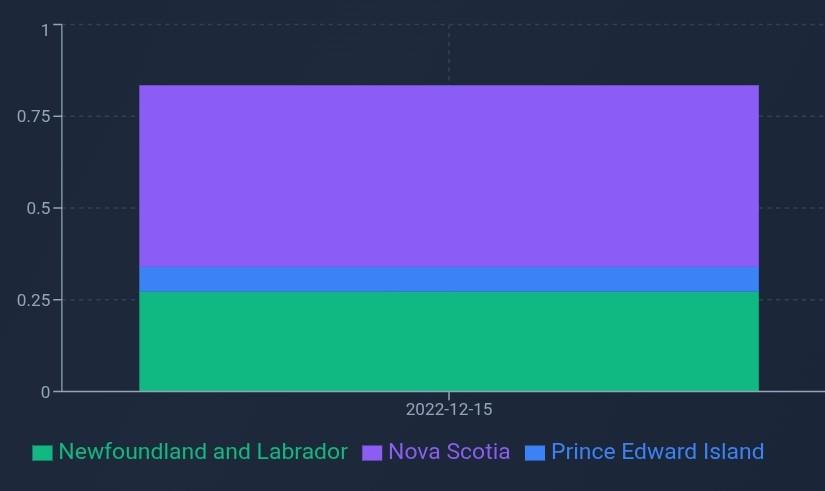
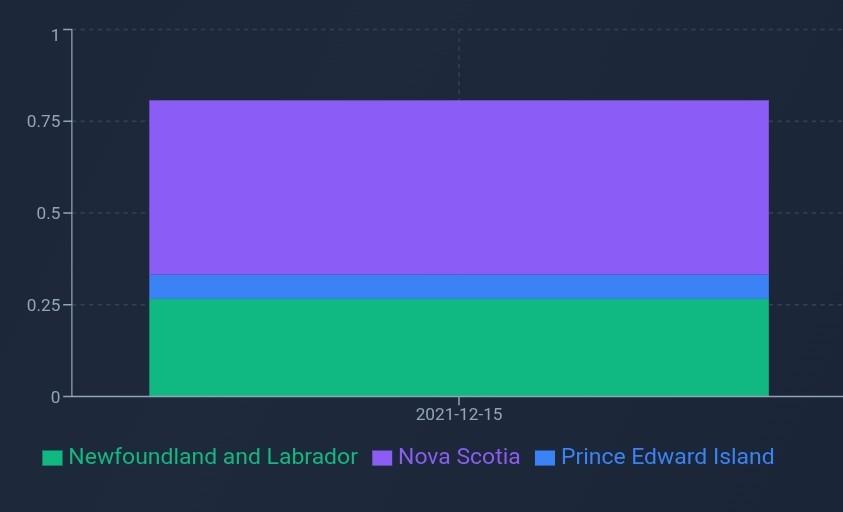
0.4749 for 2020-2021, and 0.2716, 0.0679, and 0.4947 for 2021-2022, respectively. The PHI values for the three Atlantic provinces were 0.2690 (2020–2021) and 0.2781 (2021–2022), respectively (Figures 1–3).
The DSAV values obtained from the computerized system clearly indicate that, among the three Atlantic provinces, PEI exhibited overall superior population health outcomes (smallest DSAV value). The DSAV values also indicate that overall population health deteriorated in the period 2021–2022 compared with 2020–2021 across all three Atlantic provinces. This finding is further supported by the PHI values, which also indicate subtle deterioration in 2021–2022 compared with 2020–2021, as the PHI value for 2021–2022 (0.2781) is higher than that for 2020– 2021 (0.2690) (Figure 3).
Although PSMA and PSPN values were higher in 2021–2022 than in 2020–2021, higher DSM and lower PSLE values resulted in subtly higher DSAV and PHI values in 2021–2022 compared with 2020–2021. A potential reason behind that subtle spike across indices could be that, during the period 2021-2022, COVID 19-related hospitalizations and mortality were notably higher in the 2021-2022 than in 2020-2021. Moreover, COVID 19 also had significant impact on life expectancy and therefore subtle decrease in PSLE metric value was observed during 2021-2022 period in comparison to 2020-2021 period [14]. The NLPHI architecture bridges high-level epidemiological frameworks and localized health monitoring by offering a computationally transparent, lightweight alternative to traditional burden-of-disease models such as disability- adjusted life years (DALYs). By functioning as a pragmatic monitoring tool, it enables public health teams to maintain routine oversight without the need for complex life-table analyses or proprietary databases, thereby complementing established global benchmarks. The practical utility of the framework is evidenced by its regional granularity, as demonstrated by its ability to isolate health deteriorations at a provincial level within Atlantic Canada — specifically, a rise in DSAV for Newfoundland and Labrador from 0.2660 (2020–2021) to 0.2716 (2021–2022), likely attributable to the impact of the COVID-19 pandemic — which broader national indicators might otherwise obscure. Furthermore, the operational versatility of this Python-based system allows for the customization of domains across various categories — including specific organ systems and social determinants — providing a flexible solution for settings where rigid enterprise EMR systems are unavailable. Ultimately, the inherent transparency and auditability of the framework facilitate an inspectable pipeline for calculating scalar PHIs, allowing regional teams to
visualize trajectories and allocate resources with a precise understanding of the objective weights underlying the longitudinal outcome measurements. 4.1 Ethical, Privacy, and Safety Considerations Practical implementation was demonstrated using publicly available datasets extracted from the Discharge Abstract Database (DAD). No personal identification data was obtained or used. The computerized system is a public health statistical model and is not intended to be used for the diagnosis and/or treatment of any disease(s), disorder(s), and/or condition(s).
4.2 Limitations As noted previously, the domains are customizable according to research or statistical needs. Therefore, validation in diverse settings is required to evaluate the versatility of this public health statistical model.
4.3 Future Work Integration of the computerized framework with currently available and future databases through an application programming interface (API) could expand the range of use of this public health statistical framework.
The Newfoundland and Labrador Population Health Index (NLPHI) provides a clear, inspectable, computerized framework to summarize multi-domain burdens at the region- date level, using information that is routinely available to regional and international public health teams. The formulation integrates a transparent time-loss term and a remaining-life- expectancy-weighted mortality term to form per- domain values (DSAV), then averages those values to obtain a composite scalar. The reference implementation shows that a single-workstation Qt application, built with widely adopted scientific Python libraries and plain-text storage, can support data recording, trend visualization, and export without specialized infrastructure.
The construct of burden-of-disease estimation is defined as the formal and comprehensive assessment of the aggregate impact of health pathologies on a population, typically quantified by the disparity between extant health status and an idealized longitudinal trajectory where every individual achieves full longevity in optimal health. NLPHI is strategically positioned not as a substitute for these resource-intensive and analytically complex estimations, but rather as a pragmatic surveillance instrument engineered for routine deployment. In contrast to traditional burden-of-disease methodologies that frequently require elaborate life-table analyses and opaque risk prediction algorithms associated with formal DALY calculation, this framework prioritizes computational transparency and inspectability for regional public health practitioners. By integrating a temporal loss component with a residual-life- expectancy-weighted mortality term to generate the DSAV, the architecture maintains a conceptual link with established epidemiological thinking while ensuring accessibility. Furthermore, the framework serves as an extensible platform for future calibration and the longitudinal tracking of multi-domain burdens by utilizing objective weights, such as period-specific mean age and population denominators, which ensure that resulting health outcome measurements remain contextually relevant to their specific reporting intervals. Therefore, the approach is best understood as a pragmatic monitoring device and a platform for future calibration work, not as a replacement for life-table analysis or burden-of- disease estimation.
| indices | measurement across diverse public health |
|---|---|
| Index Formula | contexts. Given that the approach relies upon |
| DSTLYA DSTLYA = | metrics such as mean age, life expectancy, and |
| DSTLHS + [(PSLE | mortality derived from routinely accessible |
| − PSMA) × DSM] | databases, it functions as a statistical modeling |
| DSAV DSAV × 100) / = (PSMA (DSTLYA × | platform rather than a clinical diagnostic tool. |
| PSPN) | Consequently, the application of this index should |
| PHI PHI = ΣDSAV / N, | be regarded as a foundation for future calibration |
| where N = number | efforts and not as a total replacement for formal |
| of domains | burden-of-disease estimations or complex life- |
| table analyses. | |
| 2.2.2 Domain Features | 2.3 Practical Implementation |
| The domains can be: demographic-specific (e.g., | 2.3.1 Data Collection |
| different age and sex groups); region-specific (e.g., | For region-specific practical implementation of |
| different provinces or districts); organ system– | NLPHI, validated datasets were extracted from the |
| specific (e.g., cardiovascular, respiratory, or | publicly available Discharge Abstract Database |
| reproductive); disease-specific (e.g., cerebral | (DAD), accessible through the Canadian Institute |
| infarction, myocardial infarction, or bronchitis); or | for Health Information (CIHI). Canadian |
| determinant-specific (e.g., physiological, mental, | provincial datasets for three Atlantic provinces — |
| or social factors such as access to care, addiction | covering total length of hospital stays for the fiscal |
| prevalence, or access to remote health | years 2020–2021 and 2021–2022 — were |
| monitoring). Domains can also be customized to | extracted [12] and are presented in Table 2. The |
| meet specific statistical needs. This construct | three Atlantic provinces were treated as three |
| allows the indices to be applied in diverse public | distinct domains for region-specific |
| health settings and, as all period-specific metrics | |
| DOI: 10 52609/jmlph v6i3 264 | | E-mail: niazmirza111@gmail com |
| implementation. | were extracted from Statistics Canada's published |
| Metrics-specific data, including province- | report [13] and are presented in Table 3. |
| specific mean age, life expectancy, and mortality, |