Full text rendered from the published PDF. The PDF is the version of record; if the two differ, the PDF governs.
INTRODUCTION
The safety of patients and property in healthcare settings is directly influenced by security response time, yet this critical aspect is often overlooked. In this article, we aim to address this gap by presenting a proposed key performance indicator (KPI) for security response times.
METHODS
To develop the proposed KPI, we followed a systematic approach. First, we defined the necessary KPI. We then collected baseline response time data and met with stakeholders to gather their insights. Subsequently, we analysed the response time data from before and after implementation of the proposed KPI, and introduced a levelling method for responses that takes into account the intensity and risk level of each situation.
RESULTS
The weekly average baseline response time for situations requiring security department intervention was found to be 8 minutes and 1 second. One year after implementing the levelling method, the data comparison revealed a substantial decrease in response times. Specifically, responses to Level 1 incidents averaged 3 minutes and 57 seconds; Level 2 incidents averaged 5 minutes and 47 seconds; and Level 3 incidents averaged 3 minutes and 59 seconds.
CONCLUSION
The application and testing of this new KPI over the course of one year demonstrated a remarkable impact on security response time. Given the lack of a published benchmark for such response, we propose a benchmark of 5 minutes.
Keywords: Health Care Evaluation Mechanisms, Health Care Sector, Quality Assurance, Health Care Quality Indicators, Health Care
Efficiency is critical for the effective delivery of services in any organisation, and the healthcare industry relies heavily upon it [1]. Within the health- care sector, performance efficiency encompasses various aspects, including administrative, medical, and technical, and its outcomes significantly impact the quality of patient care and safety [2]. To ensure optimal functioning, all parts of the healthcare system must be integrated and aligned with the organisation’s objectives. Thus, the presence of key performance indicators (KPIs) becomes essential in monitoring, analysing, and improving service delivery to achieve positive health outcomes [3].
In the healthcare setting, security response time holds immense importance as it directly affects both patient safety and the safety of the facility itself. While swift resolution of incidents is crucial, it is noteworthy that the literature has not adequately addressed the topic of security response time in healthcare settings. While response times for reach- ing arrested patients or unwell individuals have been investigated [4], [5], the importance of security response time in situations that are life-threatening, prone to escalation, or that may impact patients, their caretakers, or bystanders, has not received sufficient attention. Moreover, there is a lack of KPIs related to security response in the existing literature. The aim of this article, therefore, is to propose, develop, assess, and measure the impact of a KPI for security response in the healthcare sector.
The development of a new KPI for security re- sponse within the healthcare facility involved an extensive literature search, using keywords such as “security”, “response time”, and “healthcare setting” to identify any existing KPIs in this domain. Based on the findings, the required KPI was defined. Subsequently, stakeholders were engaged in a meet- ing to gather insights and establish the levels of response with corresponding time thresholds [6].
Defining the KPI: The proposed approach for measuring response times involved dividing the responses into three levels: Level 1, Level 2, and Level 3, according to the urgency of response required. The proposed time thresholds for each level were defined as follows: for Level 1, up to 5 minutes; Level 2, up to 10 minutes; and Level 3, up to 15 minutes. Additionally, a category was included for non-emergency situations where the response was not time-constrained.
Level 1 represents the highest priority, where an immediate and rapid response is crucial. This level includes high-risk emergency situations such as a missing patient (Code Adam), incidents involving fire or something burning (Code Red), encounters with aggressive individuals (Code White), electrical problems, situations in which someone is trapped, or Code Black (bomb threat), cases of harassment, Code Silver (active shooter), chemical spills (Code Orange), suicide attempts, Code Brown (utility failure), external disasters (Code Yellow), infant abduction (Code Pink), diesel leaks, and other similar scenarios.
Level 2 signifies the need for more responders to assist with an incident that requires attention, but is not as high-risk as a Level 1 situation. Examples of Level 2 incidents include water leaks, instances where someone is recording medical staff or the facility without permission, and similar.
Level 3 is assigned to non-critical situations that require a response but are of lower urgency. Some examples of Level 3 incidents include a patient wanting to leave the facility against medical advice, elevator malfunctions, broken ampules, patients re- fusing to leave a certain area, door problems, maintenance issues, control panel alarms, missing narcotics, missing ampules, and other similar non-
emergency situations.
Settings: This proposed KPI was developed within the context of a tertiary hospital of 729,345 square kilometres and a bed capacity of 1200. The hospital serves more than 50,000 patients and employs 9000 staff members. Additionally, there are approx- imately 3000 staff members from service providers, and the facility sees more than 20,000 visiting cars daily.
Operational KPI: Following the implementation of the KPI, security response was governed by three key principles: first, the response is determined according to the level of emergency; second, the response is also influenced by the timing of the call (in cases where a minor emergency is already in progress and a higher-risk incident occurs while en route, staff resources are redirected to the higher-risk incident); and third, the response time for each level is pre-determined. Furthermore, a review of incidents and calls is conducted.
Baseline data: To establish a baseline, all incidents were reported to the dispatch department via a designated hotline number provided to hospital staff. Each call received by the Emergency Dispatch Centre was documented, including the time of, and reason for, the call. The response team’s arrival time at the scene was then recorded, to calculate the response time. Data was collected for one year before the implementation of the new pre-determined response times, and then for one year afterwards.
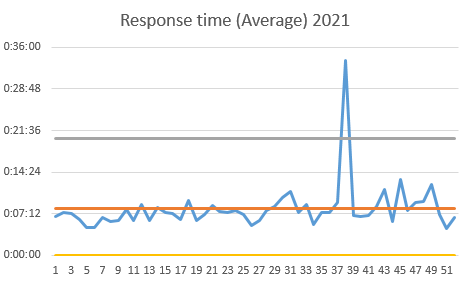
Prior to the implementation of the new KPI and response time thresholds, the weekly average re- sponse time was 8 minutes and 1 second for all security incidents across the board, whether higher- risk or non-emergency situations. However, after the new definitions and KPI were implemented, some operational plans were modified to accommodate the new response time levelling system. Data analysis of the emergency cases documented over the following year revealed response times for each of the three levels as follows: for Level 1 (high-risk) incidents, response time averaged 3 minutes and 57 seconds;
for Level 2 incidents, response time averaged 5 minutes and 47 seconds; and for Level 3 incidents, response time averaged 3 minutes and 59 seconds, with very few incidents falling into this level and no need for security to attend these situations. As a result, the average response time over the course of the year was 4 minutes and 57 seconds.
An overview of response times before and after KPI implementation is shown in Figure 1 and Figure 2.
At the time of writing, this article represents the first investigation into security response time within the healthcare sector. We believe that the implemen- tation of a key performance indicator (KPI) for such response is essential to ensure the safety and well- being of patients, staff, and sensitive information in the healthcare setting. By measuring the response time in relation to the level of risk, we can establish different time thresholds for response to different incident categories. The introduction of a KPI, and the monitoring of response times in relation to the risk level, foster an efficient environment and ac- countability, allowing deficiencies and shortcomings to be identified and addressed.
In this article, we have examined the presence of outliers in response times and conducted sub- sequent internal investigations to identify areas for improvement. We must emphasise the importance of categorising incidents according to their risk level before calculating response times, as including in- cidents in the response time calculations that do not impact the safety of individuals within the medical facility can create outliers that distort the response time data.
When aiming to define a specific response time for security personnel, it is essential to consider the parameters of the healthcare facility in question, such as its size, the number of staff, and the availability of two-way communication or surveillance systems. In our case, which involved a large medical city, we determined that a response time of 4 minutes and 57 seconds was appropriate.
The development of a new key performance indi- cator (KPI) underscores the importance of involv- ing stakeholders and fostering an environment of
openness and accountability. The use of a modified Delphi approach, conferences, and expert opinions can all be valuable in the initial stages of generating the KPI [7]. Establishing a consensus-building process by involving end users and clearly defining the purpose of creating the KPI is essential [8].
Our examination of security response times within a tertiary hospital revealed the need for a key per- formance indicator (KPI). By conducting a thorough analysis of response data, both retrospectively and utilising the levelling framework, we have acquired valuable insights into the current situation and the achievable improvements in quality.
Deviating from the initial baseline of 8 minutes and 1 second, we adopted a new paradigm that categorised response times into different levels. Level 1 demonstrated an average response time of 3 minutes and 57 seconds, followed by two subsequent levels that averaged 5 minutes and 47 seconds, and 3 minutes and 59 seconds, respectively. The culmination of these collective efforts yielded an impressive average response time of 4 minutes and 57 seconds, serving as testament to the power of refining practices based on data-driven insights.